

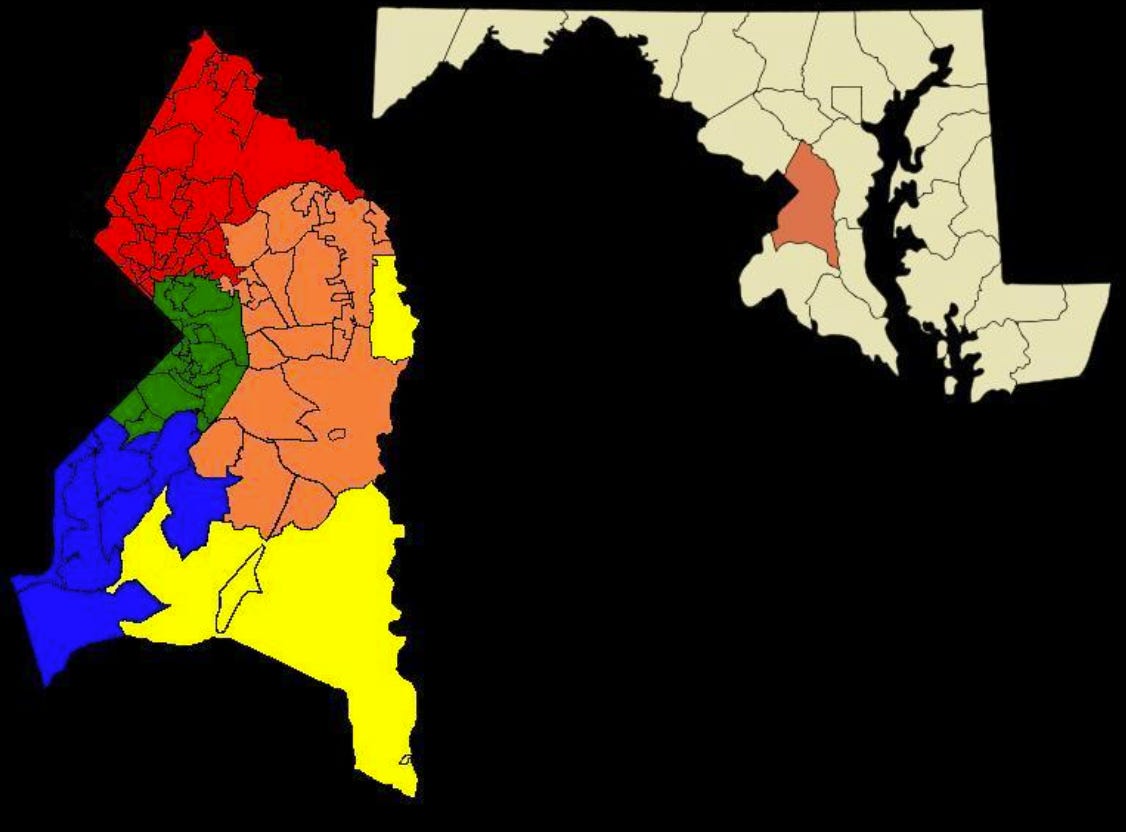
Prince George’s County, Maryland: A Full Political Slice‑and‑Dice for Democrats (and the Last Republicans Standing)
Prince George’s County is one of the most politically consistent jurisdictions in the United States. In the last presidential election, 89.3% voted Democratic and only 8.7% voted Republican. It is not a battleground county — races rarely come within five points.
But inside that overwhelming Democratic dominance, there are distinct political micro‑cultures, each with its own class structure, migration history, and civic personality.
Below is the full map.
I. The Big Picture: What the Data Says
Demographics
- 62% Black
- 28% White (but only ~10% non‑Hispanic White)
- 24% foreign‑born
- 36% bachelor’s degree or higher
- Median household income: ~$100,700
Political Climate
- Very liberal overall
- Highly educated populations tend to vote more liberal, and PG County has a strong educated base (35.87% bachelor’s+)
- Women (52.39% of population) tend to vote more Democratic nationally, reinforcing the county’s lean
This is the foundation. Now let’s break the county into its political “tribes.”
II. College Park / University Corridor
Demographic & Cultural Profile
- Younger, more mixed‑race, more transient
- High share of students, academics, and federal workers
- More renters, fewer long‑term homeowners
- More international residents (UMD pulls globally)
Political Personality
This is the Progressive Professional Bloc.
They are:
- Pro‑education
- Pro‑transit
- Pro‑environment
- Strongly Democratic, but more left‑leaning than the county average
- More likely to support reformist candidates, technocrats, or “good government” types
How they differ from the rest of PG County
Inside‑the‑beltway Black neighborhoods often vote based on:
- community ties
- church networks
- long‑standing political families
- local patronage systems
College Park voters behave more like:
- Takoma Park
- Silver Spring
- Arlington
- parts of DC’s Ward 3
They are Democrats, but not the same kind of Democrats.
III. Cheverly
Cheverly is one of the most interesting micro‑cultures in the county.
Demographic & Social Profile
- Historic ral or military households
Political Personality
This is the Civic‑Minded Middle‑Class Bloc.
They are:
- Democratic
- Pragmatic
- Community‑oriented
- Not ideological
- Very sensitive to schools, crime, and property values
They vote for:
- competence
- stability
- candidates who show up in the neighborhood
This bloc is not the same as the progressive bloc in College Park, nor the machine‑aligned bloc inside the beltway.
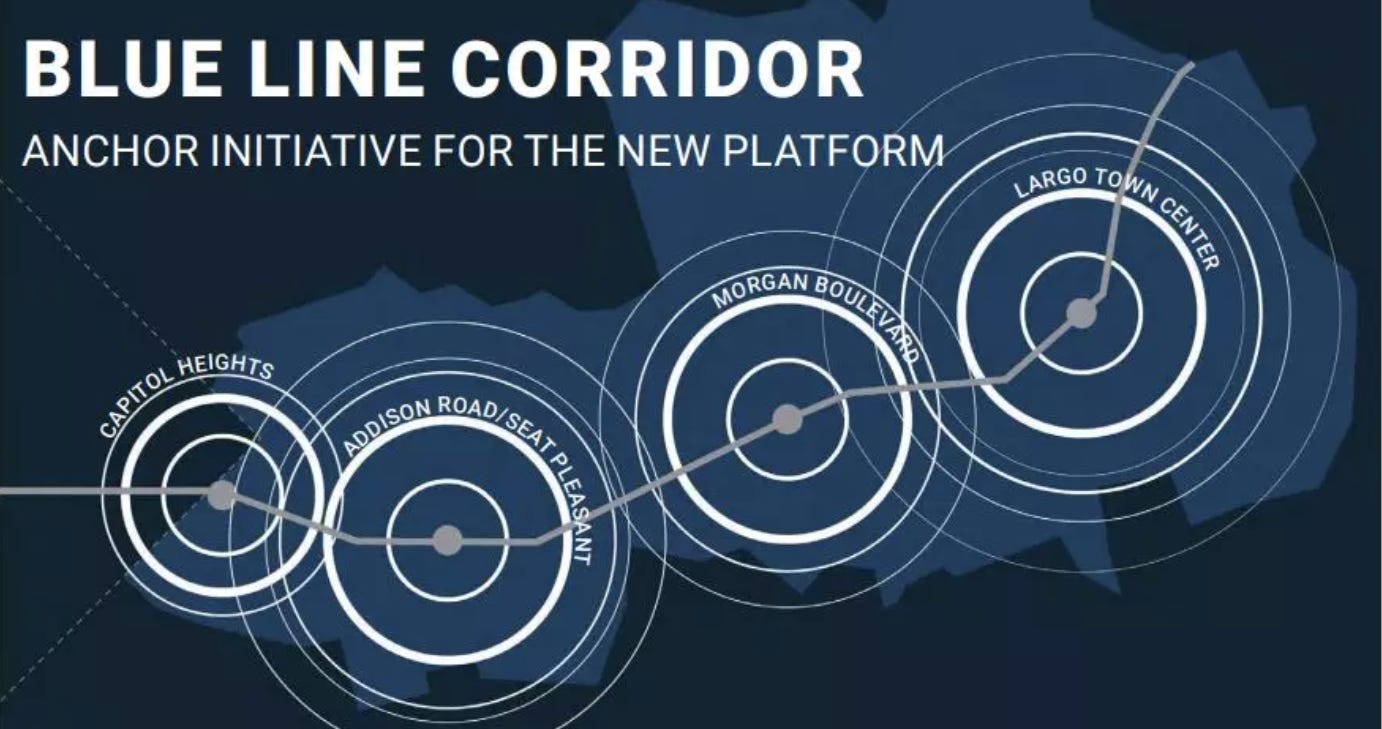
IV. Inside‑the‑Beltway Black Working‑ and Middle‑Class Communities
This includes:
- Capitol Heights
- Suitland
- District Heights
- Landover
- Glenarden
- Seat Pleasant
Demographic & Social Profile
- Smaller homes
- Older housing stock
- Lower median incomes
- Longer commute times (35.5 minutes on average countywide)
- Strong church networks
- Strong union presence historically
- High share of long‑term residents
Political Personality
This is the Traditional Democratic Base.
They are:
- loyal Democratic voters
- socially moderate
- economically progressive
- deeply skeptical of Republicans
- highly responsive to local political machines and church leadership
This is the backbone of PG County’s 89% Democratic vote share.
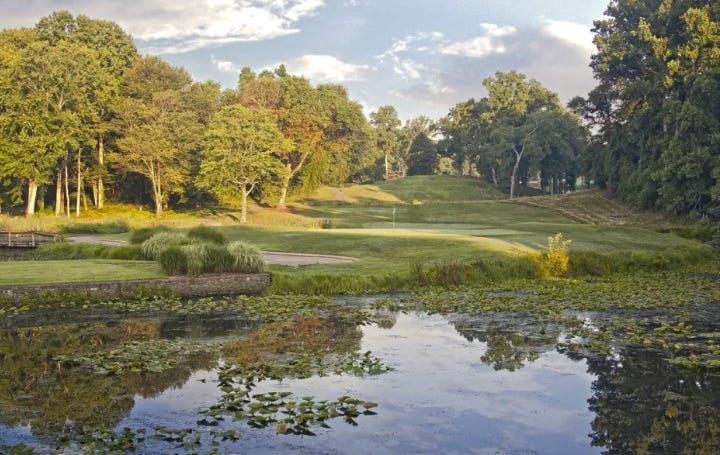
V. Bowie, Woodmore, Mitchellville
This is the Affluent Black Suburban Belt.
Demographic & Social Profile
- High incomes (many households $100k–$200k)
- High homeownership
- Large homes, planned communities
- Many federal workers, contractors, and professionals
- Strong presence of Black fraternities, sororities, and country‑club networks
Political Personality
This is the Affluent Establishment Democratic Bloc.
They are:
- fiscally comfortable
- socially moderate
- strongly pro‑education
- strongly pro‑government employment
- supportive of mainstream Democratic candidates
They are not progressive activists.
They are not machine voters.
They are status‑quo Democrats who want stability and competence.
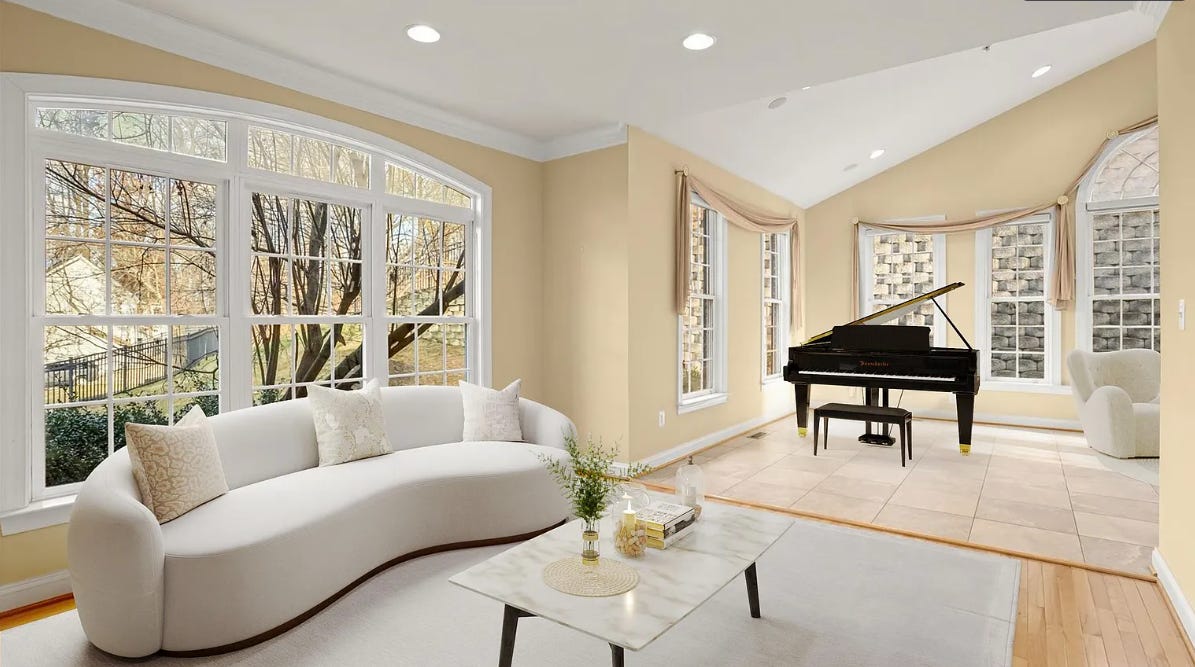
VI. Fort Washington / South County
This is the Quiet Affluent Black Exurban Bloc.
Demographic & Social Profile
- Large homes
- Quiet neighborhoods
- Older, more established families
- Many retirees
- Many military and federal retirees
- High homeownership
- High income
Political Personality
They vote like:
- upper‑middle‑class suburban Democrats
- socially moderate
- fiscally moderate
- strongly anti‑Republican
- not particularly ideological
They are the least “activist” part of the county.
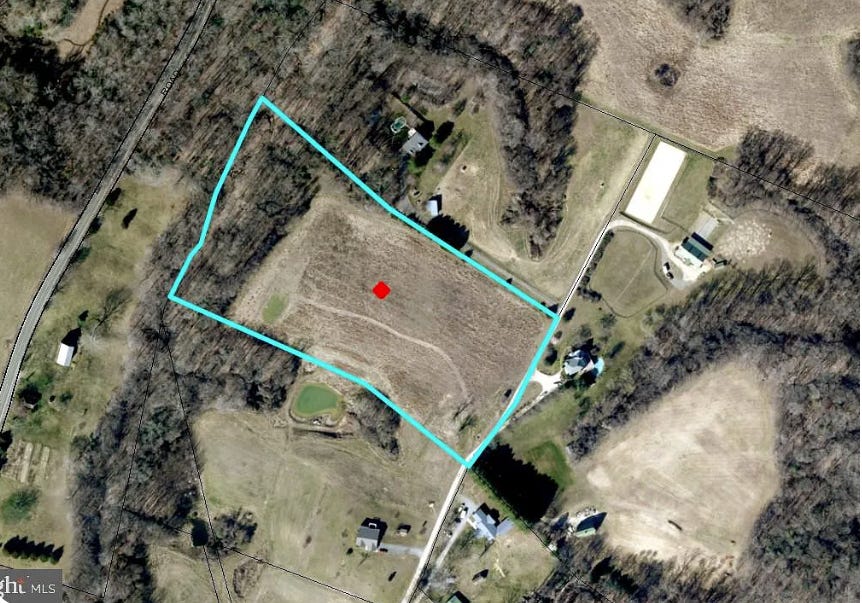
VII. District 9 (Brandywine, Accokeek, Croom, rural south)
This is the Rural‑Suburban Hybrid Bloc.
Demographic & Social Profile
- Mix of farms, townhouses, and new subdivisions
- More land, more space
- More car‑dependent
- More military families
- More newcomers from Charles County spillover
Political Personality
Still overwhelmingly Democratic, but:
- more moderate
- more sensitive to taxes
- more sensitive to development
- more independent‑minded
This is the closest thing PG County has to a “swing” Democratic bloc — but they still vote blue by large margins.
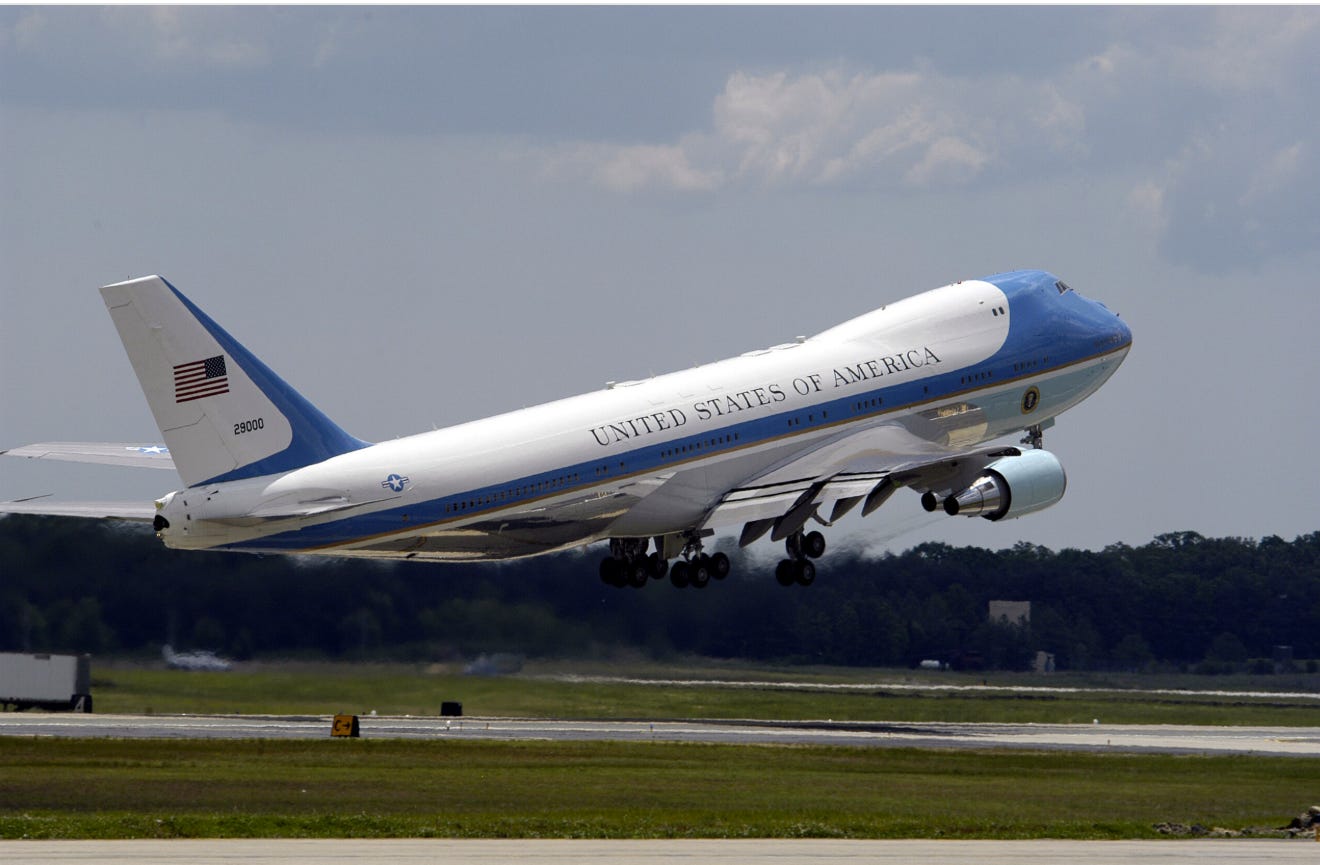
VIII. Joint Base Andrews: The Military Vote
Demographic & Social Profile
- Active‑duty service members
- Civilian DoD employees
- Military retirees
- Many families with children
- High mobility
- High federal employment
Political Impact
Military communities nationwide tend to be:
- more moderate
- more pragmatic
- less ideological
- more diverse than stereotypes suggest
In PG County, the military vote:
- reinforces Democratic dominance, because the surrounding population is overwhelmingly Democratic
- adds a stabilizing, moderate tone
- increases support for candidates who emphasize competence, public safety, and federal funding
They are not a Republican pocket.
They are a moderating Democratic force.
IX. Are There Any Republicans Left?
Yes — but very few.
Republicans make up only 8.7% of the vote.
Where they are
- Pockets of older White residents in Laurel
- A few enclaves near the Anne Arundel border
- Some military retirees
- A handful of conservative immigrants
- Some business owners in mixed‑race suburbs
Political Personality
They are:
- older
- more suburban than rural
- more likely to be long‑term homeowners
- more likely to feel culturally displaced
But the stereotype that they “hate Blacks” is not supported by the data.
The more accurate description is:
> They are culturally conservative people who stayed put while the county changed around them.
They are shrinking every year.
---
X. What You’re Missing (The Hidden Layer)
There is one more major political force in PG County:
The Black Immigrant Vote
- West African
- Caribbean
- Central American
- Afro‑Latino
This group is:
- growing fast
- economically diverse
- socially moderate
- strongly Democratic
- highly church‑connected
- less tied to old PG political machines
They are the future of the county’s political culture.
---
XI. Summary Table
Check out the wetlands located in the Suitland/Morningside area of Prince George’s County
Great matrix 👍