

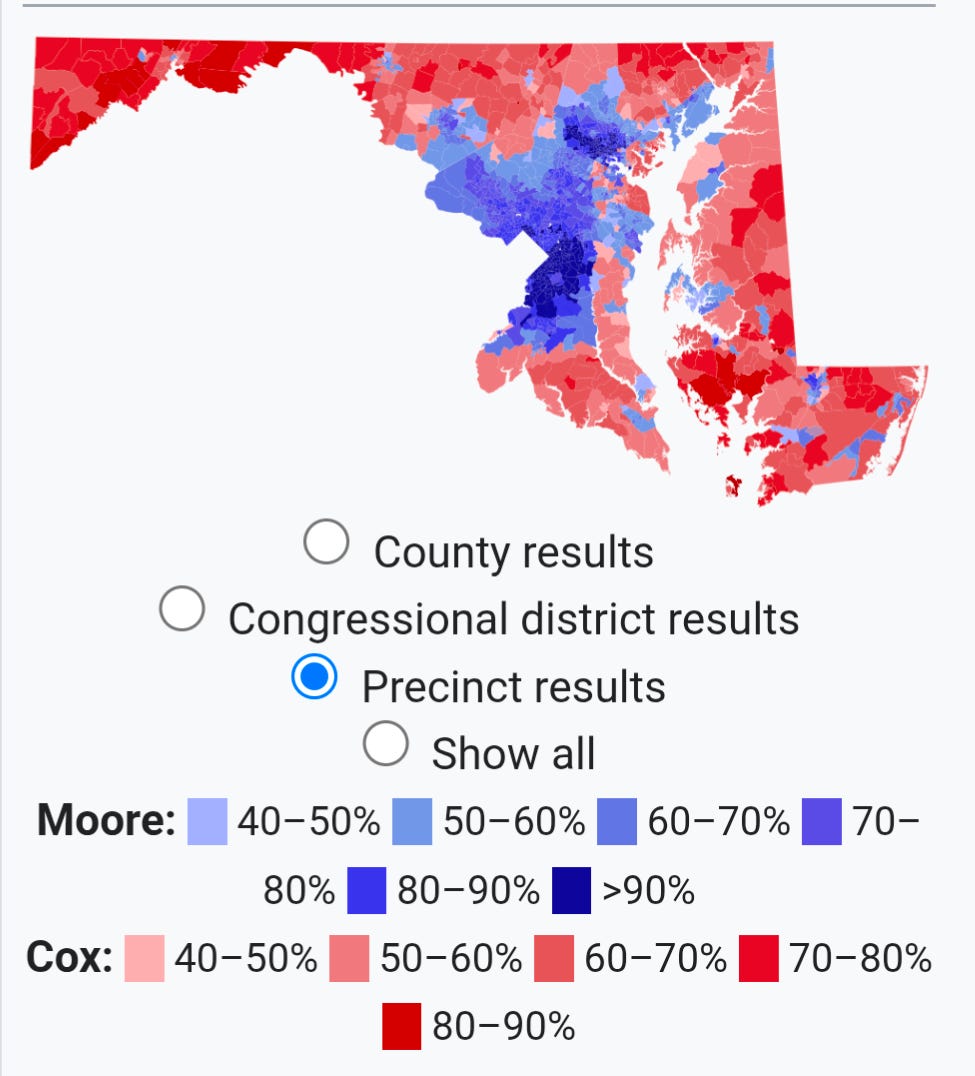
Governor Moore is expected to win Maryland by a huge margin.
The reality is that a large and vocal group of people is small in comparison to the number of voters but large. As far as my tolerance for silliness are concerned, nobody’s going to vote for Moore. Nobody wants him, No Moore, all that silly stuff they always say. But the reality of it is that he’s the governor, the people of Maryland like.
When we look at the general election numbers from 4 years ago, we can see a distinctive pattern. In the 10 largest counties the governor wins. The 14 smallest counties the governor loses and you may think well isn’t that significant? Doesn’t that give the Republicans an edge if they’re winning? 14 counties and Democrats only win 10? Governor Moore racked up a 30-point win over Dan Cox by winning the 10 biggest counties with a solid victory. When you take a look at the list, keep in mind that Prince George’s County has the largest number of Democratic voters and Governor Moore pulled close to 90% of the vote. He was in the ‘80s in Baltimore City and then high 70s in Montgomery. So when you look at the large counties including Baltimore as a county, he runs up the big numbers of the places where there are the most voters. Here’s some information for you. I know some of you will find it interesting and others of you wearing red hats that say make America great again will find this confusing but what the heck keep reading it until you understand what it says.
Here’s the full 2022 general election (Moore vs. Cox, November 8, 2022), with every Maryland jurisdiction ranked by Moore’s winning percentage from highest to lowest, and Cox’s losing percentage alongside.
Statewide: Moore 64.53% (1,293,944 votes) — Cox 32.12% (644,000 votes). Moore’s margin was about 32.4 points, the largest for any Maryland gubernatorial candidate since William Donald Schaefer in 1986.
Ranked by Moore’s share (highest to lowest):
Prince George’s County — Moore 89.23% / Cox 8.32%
Baltimore City — Moore 88.11% / Cox 8.56%
Montgomery County — Moore 78.36% / Cox 18.79%
Howard County — Moore 69.87% / Cox 26.49%
Charles County — Moore 68.55% / Cox 29.04%
Baltimore County — Moore 63.40% / Cox 32.70%
Anne Arundel County — Moore 57.37% / Cox 38.80%
Frederick County — Moore 53.46% / Cox 43.19%
Kent County — Moore 51.92% / Cox 44.79%
Talbot County — Moore 51.67% / Cox 44.97%
Wicomico County — Moore 45.79% / Cox 50.71%
Calvert County — Moore 44.59% / Cox 52.34%
Harford County — Moore 43.76% / Cox 52.21%
Dorchester County — Moore 41.02% / Cox 55.49%
Saint Mary’s County — Moore 39.93% / Cox 56.10%
Carroll County — Moore 39.11% / Cox 56.59%
Queen Anne’s County — Moore 38.92% / Cox 57.31%
Worcester County — Moore 38.64% / Cox 58.68%
Washington County — Moore 38.33% / Cox 58.43%
Somerset County — Moore 36.48% / Cox 60.45%
Cecil County — Moore 36.27% / Cox 60.10%
Caroline County — Moore 32.13% / Cox 64.02%
Allegany County — Moore 31.32% / Cox 65.19%
Garrett County — Moore 22.18% / Cox 74.14%
Sources: Maryland State Board of Elections, official 2022 general results; Wikipedia — 2022 Maryland gubernatorial election, by county.
The breaking point is right at #10/#11: Moore carried the top 10 jurisdictions (all at 50%+) and lost the bottom 14 — a useful framing point, since his landslide was built on running up the score in the big-population Democratic strongholds (PG, Montgomery, Baltimore City/Baltimore County) rather than geographic breadth. Garrett was his worst (22.2%), and Prince George’s was his best (89.2%). Let me know if you’d like this alongside the 2026 primary numbers as a comparison table for the article.