

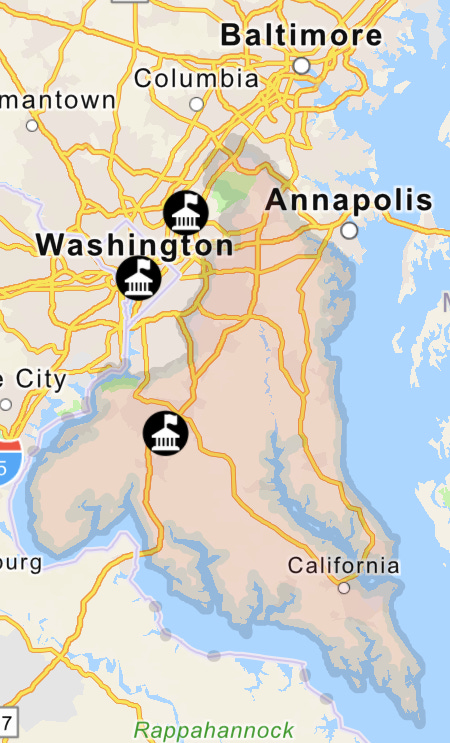
1. Gubernatorial-Year Turnout Baselines (2022)
Source: Maryland SBE official turnout by county and party.
Below are the Democratic eligible voters and Democratic turnout for each CD5 county.
Prince George’s County (CD5 portion only)
Countywide Democratic eligible voters: 462,097
Countywide Democratic turnout: 44.08% → 203,000 Democratic votes countywide.
CD5 share of PG: ~35–40%.
Estimated Democratic votes from PG in CD5:
👉 71,000–81,000
Charles County (fully in CD5)
Democratic eligible voters: 74,373
Democratic turnout: 47.17% → ~35,000 Democratic votes
👉 ~35,000 Democratic votes
Anne Arundel County (CD5 portion only)
Countywide Democratic eligible voters: 173,922
Countywide Democratic turnout: 56.54% → ~98,000 Democratic votes countywide.
CD5 share of AA: ~12–15%.
Estimated Democratic votes from AA in CD5:
👉 11,500–14,500 Democratic votes
Calvert County (fully in CD5)
Democratic eligible voters: 23,779
Democratic turnout: 57.80% → ~13,700 Democratic votes
👉 ~13,700 Democratic votes
St. Mary’s County (fully in CD5)
Democratic eligible voters: 25,474
Democratic turnout: 49.84% → ~12,700 Democratic votes
👉 ~12,700 Democratic votes
2. Summary Table — Democratic Vote Output in a Gubernatorial Year
| County / Portion | Democratic Eligible Voters | Democratic Turnout % | Est. Democratic Votes in CD5 |
| Prince George’s (CD5 portion) | 462,097 countywide | 44.08% | 71,000–81,000 |
| Charles | 74,373 | 47.17% | ~35,000 |
| Anne Arundel (CD5 portion) | 173,922 countywide | 56.54% | 11,500–14,500 |
| Calvert | 23,779 | 57.80% | ~13,700 |
| St. Mary’s | 25,474 | 49.84% | ~12,700 |
Key structural fact:
Even in a low‑turnout gubernatorial year, Prince George’s produces more Democratic votes than Charles, Calvert, St. Mary’s, and the AA crescent combined.
📰 Maryland Wire–Style Article (Gubernatorial-Year Version)
“Where the Votes Really Are in Maryland’s 5th District — The Gubernatorial-Year Map”
By Barry O’Connell
Maryland Wire
THE QUIET TRUTH ABOUT CD5 TURNOUT
Most Marylanders think they understand the 5th Congressional District. They know it’s part Prince George’s, part Southern Maryland, part Anne Arundel crescent. But almost nobody — including many insiders — can tell you where the votes actually come from in a gubernatorial year, when turnout drops and the electorate shrinks into its most reliable core.
So here is the map behind the race. No candidate framing. No spin. Just the numbers.
PRINCE GEORGE’S COUNTY: STILL THE CENTER OF GRAVITY
Even in a low‑turnout year, Prince George’s County dominates CD5. Only about 35–40% of the county lies inside the district, but that slice includes Bowie, Upper Marlboro, Clinton, Brandywine, and Camp Springs — the deep-blue anchor.
In 2022, Prince George’s Democrats turned out at 44.08%, producing more than 200,000 Democratic votes countywide. The CD5 portion alone accounts for:
- 71,000–81,000 Democratic votes
That is the largest bloc in the district by a wide margin.
CHARLES COUNTY: THE SOUTHERN MARYLAND HEAVYWEIGHT
Charles County is fully inside CD5 and remains the second‑largest Democratic engine in the district. In 2022, Democratic turnout was 47.17%, yielding:
- ~35,000 Democratic votes
Charles is the only Southern Maryland county that can move district‑wide numbers on its own.
ANNE ARUNDEL COUNTY: THE BLUE CRESCENT
The CD5 portion of Anne Arundel is not the county’s conservative north. It’s the southern and western crescent — Crofton, Odenton, Maryland City, Edgewater, Riva, Mayo, Shady Side.
In 2022, Anne Arundel Democrats turned out at 56.54%, one of the highest rates in the state. The CD5 slice contributes:
- 11,500–14,500 Democratic votes
A meaningful bloc, but not a decisive one.
CALVERT COUNTY: SMALL BUT DEPENDABLE
Calvert is Republican‑leaning, but Democratic turnout in 2022 was a strong 57.80%, producing:
- ~13,700 Democratic votes
This puts Calvert slightly ahead of St. Mary’s in Democratic raw vote output.
ST. MARY’S COUNTY: THE REDDEST CORNER OF THE DISTRICT
St. Mary’s Democrats turned out at 49.84% in 2022, generating:
- ~12,700 Democratic votes
A stable floor, but the smallest Democratic bloc in the district.
THE BOTTOM LINE FOR 2026
If you want to understand CD5 in a gubernatorial year, understand this:
- Prince George’s County still decides the race.
- Charles County still shapes the race.
- Anne Arundel’s crescent still influences the margins.
- Calvert and St. Mary’s still fill out the map.
Most Marylanders couldn’t tell you whether Calvert or St. Mary’s produces more Democratic votes — and that’s exactly why this breakdown matters. CD5 is not intuitive. It is structurally lopsided, and the gubernatorial electorate makes that imbalance even sharper.
In 2026, the district will be decided by the voters who show up when turnout is low, attention is thin, and only the most reliable Democrats cast ballots. This is the map of that electorate.