

Maryland Democrats didn’t whisper their preferences in 2026 — they shouted them.
Across two major congressional primaries, MD‑6 and MD‑5, voters chose institutional steadiness over progressive confrontation. They didn’t drift. They didn’t wobble. They made a choice.
And the choice was unmistakable:
Centrist Democrats won. Progressive candidates didn’t.
In MD‑6, April McClain Delaney — backed by the full congressional delegation and Gov. Wes Moore — defeated David Trone, who had positioned himself as the more progressive alternative.
In MD‑5, Adrian Boafo emerged from a 24‑candidate field while the progressive lane fractured between Quincy Bareebe, Wala Blegay, and the mixed‑signal campaign of Rushern Baker.
But the statewide pattern only becomes fully visible when you drill down into the county‑level numbers — and that’s where the work of Len Foxwell, one of the most respected strategists in Maryland politics, becomes essential.
Foxwell’s analysis doesn’t just confirm the centrist consolidation.
It explains why it happened.
The Statewide Pattern: Stability Over Insurgency
Maryland Democrats didn’t reject progressive ideas. They rejected progressive instability.
In both MD‑6 and MD‑5, the institutional lane was unified, disciplined, and consistent.
The progressive lane was divided, tonally mismatched, and in some cases, self‑sabotaging.
- McClain Delaney ran a classic coalition campaign.
- Boafo ran a disciplined, Hoyer‑aligned institutional campaign.
- Bareebe ran a militant progressive campaign, importing Jamaal Bowman — a move that energized the far left but alienated the broader electorate.
- Blegay collapsed despite institutional support in Prince George’s County.
- Baker confused voters by abandoning his long‑established centrist brand.
The voters responded accordingly.
But to understand how Boafo built a winning coalition — and why the progressive lane collapsed — you need to look at the counties. And that’s where Foxwell’s memo becomes the spine of the story.
Foxwell’s Memo: The County‑Level Proof
Below is Foxwell’s analysis, presented exactly as he wrote it — his voice, his framing, his numbers.
Foxwell (in his own words)
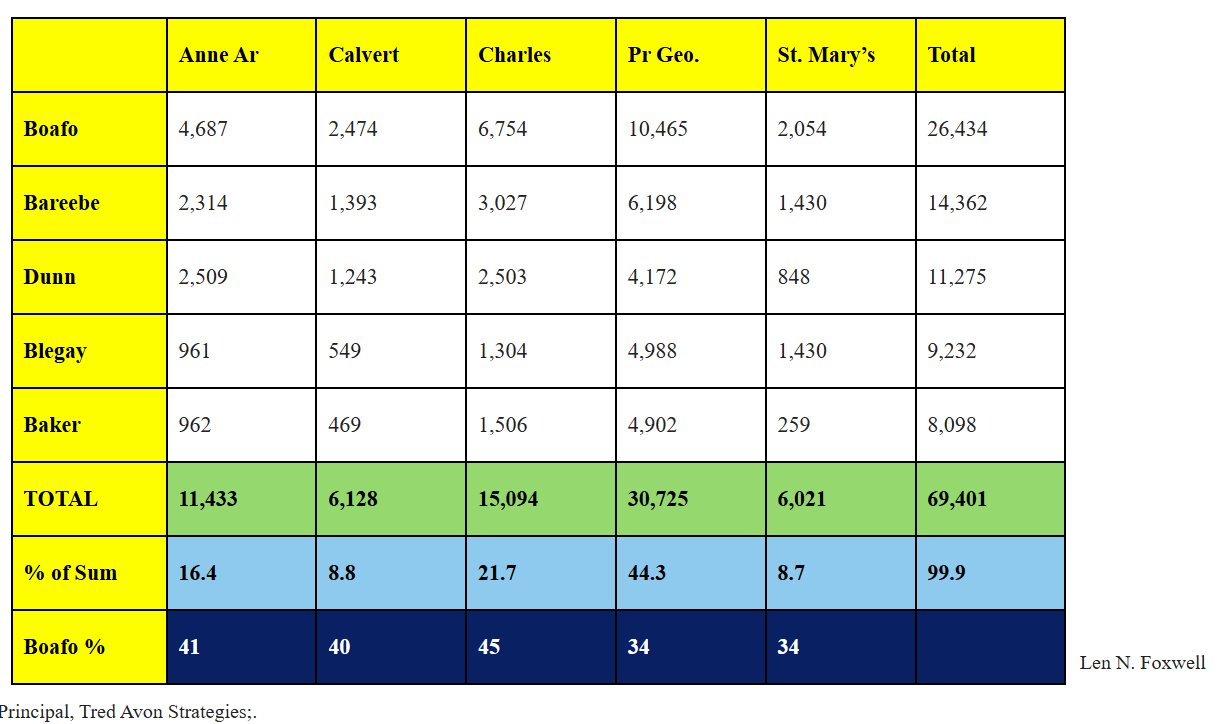
“An interesting readout from the county breakdowns. Bearing in mind that the vote totals are only of the five major candidates, to the exclusion of the rest. Much to take away, but my first reaction is just how strong, specifically, Adrian ran in Charles County. It was your strongest county both in overall percentage of vote and in his head-to-head strength against Q. Bareebe.
Furthermore, my sense is that this number, strong as it is, was artificially low because of the presence of favorite sons Ellis and Collins on the Charles ballot. While I can’t substantiate this for lack of polling, my gut tells me that Adrian would have picked up a true majority of the combined 3,100 votes that were cast, combined, for Ellis and Collins. Just as Adrian has ample room to grow in Prince George’s without Blegay and Baker on a ballot, so too does he have more room to grow in Charles once local candidates aren’t a factor.
This is just further confirmation that the messaging of Blegay and Bareebe in this campaign was substantively and tonally out of sync in the two wealthiest Black jurisdictions in the United States. Particularly at the very moment when the principal source of that wealth is now under existential threat. Will see if anything else shows up in the remaining mailed ballots that is worthy of note.”
County Breakdown (Foxwell’s Table)
(Totals reflect the five major candidates only
)
| County | Boafo | Bareebe | Dunn | Blegay | Baker | Total | Boafo % |
| Anne Arundel | 4,687 | 2,314 | 2,509 | 961 | 962 | 11,433 | 41% |
| Calvert | 2,474 | 1,393 | 1,243 | 549 | 469 | 6,128 | 40% |
| Charles | 6,754 | 3,027 | 2,503 | 1,304 | 1,506 | 15,094 | 45% |
| Prince George’s | 10,465 | 6,198 | 4,172 | 4,988 | 4,902 | 30,725 | 34% |
| St. Mary’s | 2,054 | 1,430 | 848 | 1,430 | 259 | 6,021 | 34% |
My Analysis: What Foxwell’s Numbers Really Tell Us
Foxwell’s memo doesn’t just illuminate the MD‑5 race — it clarifies the entire ideological landscape of Maryland’s Democratic electorate.
1. Charles County wasn’t just strong for Boafo — it was suppressed strength.
Ellis and Collins siphoned more than 3,000 votes as local favorites.
Remove them, and Boafo likely clears a majority.
This means Boafo’s coalition isn’t just broad — it’s expandable.
2. Prince George’s County gives Boafo even more room to grow.
Once Baker and Blegay are off the ballot, the institutional lane consolidates further.
Boafo’s 34% in PG is a floor, not a ceiling.
3. The progressive message misfired in the two wealthiest Black counties in America.
This is the heart of Foxwell’s insight.
PG and Charles are not just wealthy Black jurisdictions — they are the wealthiest Black jurisdictions in the United States.
And they are facing an existential economic threat.
At that moment, voters weren’t looking for a fight with the Democratic Party.
They were looking for someone who could protect what they’ve built.
Progressive militancy didn’t match the mood.
Institutional stability did.
4. The MD‑5 numbers reinforce the MD‑6 pattern.
In both races:
- The centrist lane was unified.
- The progressive lane was fractured.
- Voters rewarded steadiness.
- Voters rejected volatility.
5. Maryland Democrats chose continuity — not out of fear, but out of clarity.
They knew exactly what they were doing.
The Final Word
Maryland’s 2026 primaries weren’t a fluke.
They weren’t a one‑off.
They were a referendum on tone, temperament, and trust.
Foxwell’s county‑level analysis gives us the proof.
The statewide results give us the pattern.
Together, they tell a single story:
Maryland Democrats chose the candidates who could hold the coalition together — not the ones who wanted to blow it up.
Excellent. Thank you. I yearn for the day when we can reclaim the true meaning of “progressive!” The hijacked one takes on a life of its own and eclipses the value of what once gave it meaning.
Why do you use the term “progressive”? They are LIBERALS!